
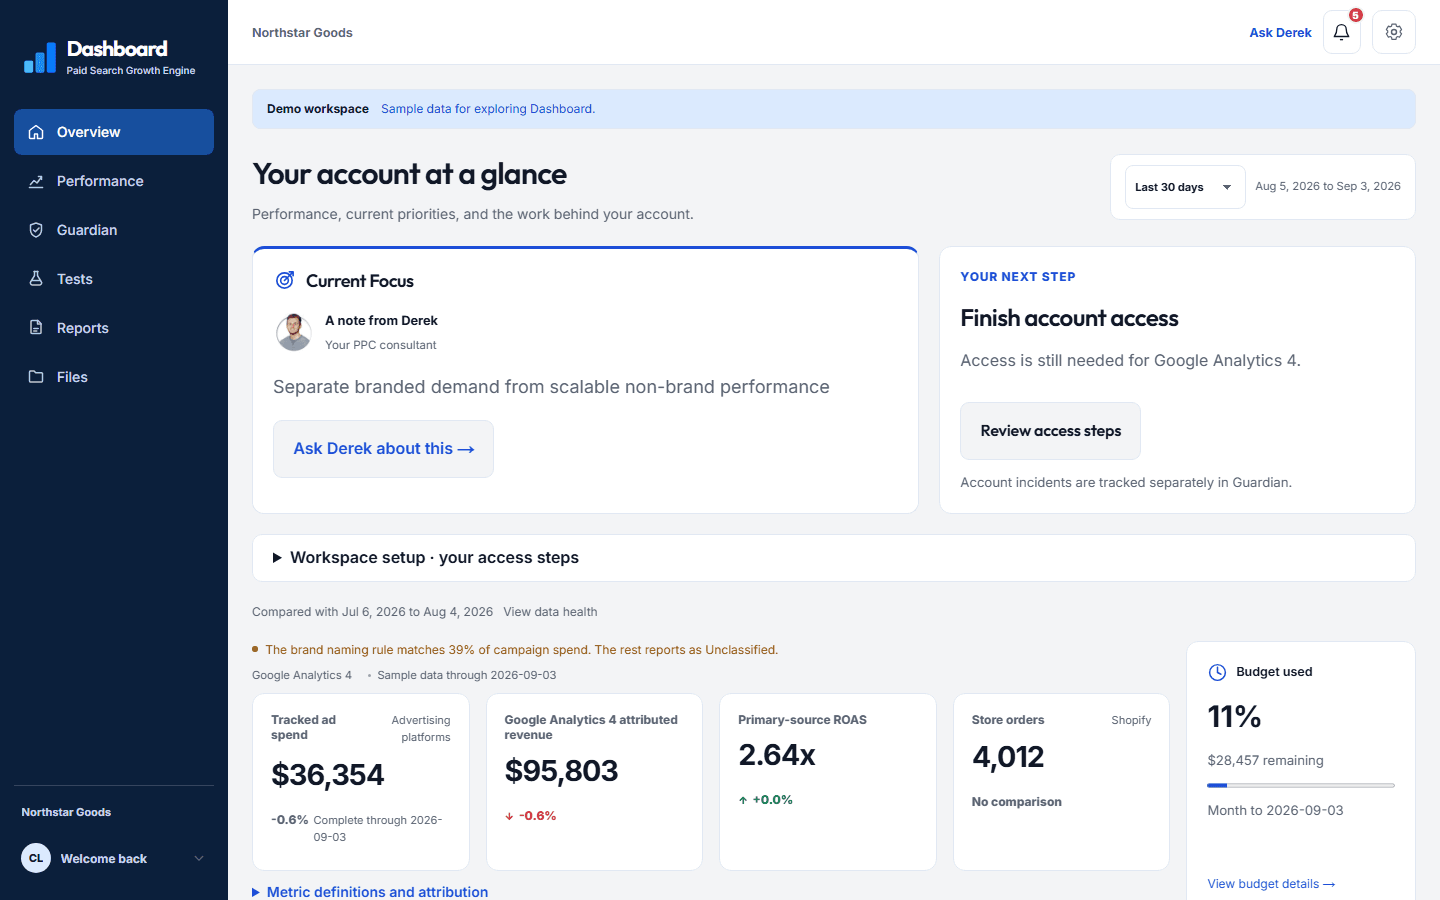
A useful PPC dashboard should show whether paid search is producing the business outcome you want, what changed, how reliable the data is, and what decision comes next. Spend, clicks, and conversions belong in the report. They are not enough on their own.
I start with the question a client needs to answer. Should we move budget? Is lead quality improving? Did a product group lose coverage? Did performance change because of demand, tracking, inventory, or an account edit? The dashboard should make that investigation faster rather than burying it under extra charts.
Start with outcomes, then add the paid search inputs
The first view should connect the outcome to the inputs that produced it. That usually means cost beside a verified conversion or revenue measure, with enough trend and comparison context to spot a meaningful change. A total without a date range, source, or definition invites the wrong conclusion.
| Measure | What it should represent | Decision it supports |
|---|---|---|
| Spend | Platform cost for the stated account, scope, and date range | Whether budget is pacing as intended |
| Conversions | The named primary actions used for reporting or bidding | Whether campaigns are producing the tracked outcome |
| Cost per outcome | Spend divided by a clearly defined conversion stage | Where efficiency changed and whether quality supports it |
| Revenue or value | Source-backed transaction, customer, or assigned outcome value | Whether the result supports the business economics |
| Trend and comparison | A like-for-like period with seasonality and material changes noted | Whether the movement deserves action or more evidence |
Google Ads lets account users create platform dashboards from scorecards, reports, tables, notes, and other components. Its dashboard documentation explains those controls. A client reporting dashboard has a broader job: connect platform data with business context and the management work around it.
Lead-generation reporting should continue past the form fill
For lead generation, I separate enquiries from qualified leads, opportunities, customers, and source-backed value when the CRM data allows it. I also show rejection reasons when they can change targeting, landing pages, forms, or sales follow-up. Cost per form fill can look efficient while the campaign sends people outside the service area or enquiries the sales team cannot use.
Counts should sit beside rates. Ten qualified leads out of 20 enquiries tells a different story from one qualified lead out of two, even though both produce the same qualification rate. Low-volume segments need records and context, not confident conclusions built from tiny samples.
The full operating chain is covered in PPC reporting for lead generation, including qualified leads, opportunities, customers, revenue, CRM definitions, and reconciliation.
Ecommerce reporting needs product and attribution context
For ecommerce, revenue, orders, return on ad spend, average order value, product or category performance, and Merchant Center coverage can all matter. Margin and inventory may change the decision even when the reported return looks stable. A campaign that spends efficiently on products the business cannot replenish may need a different budget choice from one supporting priority stock.
Platform revenue and analytics revenue may disagree because of attribution rules, conversion windows, consent, time zones, refunds, and processing. The dashboard should state which source each figure uses. It should not blend conflicting systems into a number that looks precise but cannot be traced.
My guide to ecommerce PPC reporting and measurement explains how I keep definitions, product context, attribution limits, and operating decisions together.
Show freshness and measurement limits beside the result
Every important source should have a visible refresh time or reporting-through date. Freshness is not the same as accuracy. Recent platform data can still change because of conversion lag or modelled results, while CRM outcomes may arrive days or weeks after the click. A label such as ‘updated today’ needs the source and scope behind it.
Google documents how conversion lag can change recent CPA and ROAS figures. I use that lag as reporting context instead of treating the newest conversion totals as final.
- Name the source for each business-critical figure.
- Show the reporting period and the last successful refresh.
- Document attribution windows, time zones, conversion lag, and consent effects.
- Flag missing, delayed, duplicated, or rejected events instead of silently treating them as zero.
- Keep metric definitions stable and record when they change.
Add annotations, account health, and decision context
A performance change often follows something outside the chart: a budget move, bidding change, new landing page, promotion, stock issue, tracking release, sales-capacity constraint, or shift in demand. Annotations let the reader test those explanations against the timeline. Without them, the same chart can support several incompatible stories.
Account-health information belongs near performance when it changes what the result means. Budget pacing, unusual spend, conversion tracking, and Merchant Center coverage can explain why delivery changed. Health checks should identify the condition, timing, severity, owner, and next action. A wall of green status badges does not help a client decide anything.
A recommendation needs an owner and a review point
I publish a next step only after reviewing the evidence. The note should state what will change, why, who owns it, and when the result will be reviewed. The dashboard then becomes a record of decisions as well as a reporting surface.
A management dashboard is more than disconnected charts
A collection of charts can answer narrow data questions. A useful management dashboard connects those views to campaign changes, measurement limits, account health, files, recommendations, and the conversation with the person managing the account. The extra value is interpretation and continuity, not a larger chart count.
That distinction also prevents the dashboard from pretending to replace the source platforms. Account operators still need Google Ads, Microsoft Ads, analytics, commerce systems, and the CRM for detailed investigation. The client view should summarize what matters, preserve a path back to the evidence, and make the current decision easy to find.
Use this checklist before adding another widget
- Can a client identify the main business outcome without opening another page?
- Are conversion, revenue, and lead-stage definitions visible and stable?
- Can the reader see the source, date range, refresh time, and attribution limits?
- Do annotations explain material account and business changes?
- Does each alert or recommendation lead to an owner and next action?
- Can the reader move from the summary to supporting campaign, product, lead, or change evidence?
You can explore my sample PPC client dashboard to see how I keep reporting, account health, files, and reviewed next steps together. Dashboard access is included with my Google Ads management and is not sold as standalone reporting software.


